Overview
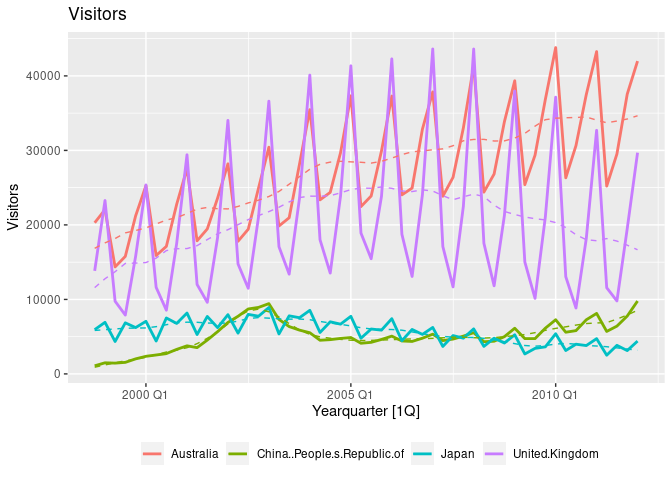
The iNZightTS package provides some simple analysis tools for exploring time series data, which is used by iNZight. The package uses tidyverts to store and process time series data and ggplot2 to produce customisable graphics.
Installation
The stable version can be installed from CRAN:
install.packages("iNZightTS")Install from GitHub:
remotes::install_github("iNZightVIT/iNZightTS")Usage
Getting started
Use the inzightts function to create a temporal data set to be used by the functions of the package. The data is stored as a tsibble.
data <- visitorsQ |>
    tidyr::pivot_longer(!Date, names_to = "Country", values_to = "Visitors") |>
    inzightts(key = "Country")
data
#> # A tsibble: 216 x 3 [1Q]
#> # Key:       Country [4]
#>      index Country   Visitors
#>      <qtr> <chr>        <int>
#>  1 1998 Q4 Australia    20288
#>  2 1999 Q1 Australia    22047
#>  3 1999 Q2 Australia    14362
#>  4 1999 Q3 Australia    15775
#>  5 1999 Q4 Australia    21209
#>  6 2000 Q1 Australia    25261
#>  7 2000 Q2 Australia    15891
#>  8 2000 Q3 Australia    17117
#>  9 2000 Q4 Australia    22761
#> 10 2001 Q1 Australia    27539
#> # ℹ 206 more rowsDecompositions
Time series data often exhibit features such as trend, season and cycle. A decomposition plot breaks the data into visual components which simplies the analysis.
dcmp <- data |>
    dplyr::filter(Country == "Australia") |>
    inzightts() |>
    decomp()
dcmp
#> # A dable: 54 x 8 [1Q]
#> # Key:     Country, .model [1]
#> # :        Visitors = trend + season_year + remainder
#>    Country   .model                        index Visitors  trend season_year remainder season_adjust
#>  * <chr>     <chr>                         <qtr>    <dbl>  <dbl>       <dbl>     <dbl>         <dbl>
#>  1 Australia feasts::STL(Visitors ~ tre… 1998 Q4    20288 16858.       2191.     1239.        18097.
#>  2 Australia feasts::STL(Visitors ~ tre… 1999 Q1    22047 17586.       7515.    -3054.        14532.
#>  3 Australia feasts::STL(Visitors ~ tre… 1999 Q2    14362 18173.      -5731.     1920.        20093.
#>  4 Australia feasts::STL(Visitors ~ tre… 1999 Q3    15775 18928.      -3975.      822.        19750.
#>  5 Australia feasts::STL(Visitors ~ tre… 1999 Q4    21209 19248.       2191.     -230.        19018.
#>  6 Australia feasts::STL(Visitors ~ tre… 2000 Q1    25261 19601.       7515.    -1855.        17746.
#>  7 Australia feasts::STL(Visitors ~ tre… 2000 Q2    15891 20127.      -5731.     1496.        21622.
#>  8 Australia feasts::STL(Visitors ~ tre… 2000 Q3    17117 20652.      -3975.      439.        21092.
#>  9 Australia feasts::STL(Visitors ~ tre… 2000 Q4    22761 20972.       2191.     -402.        20570.
#> 10 Australia feasts::STL(Visitors ~ tre… 2001 Q1    27539 21528.       7515.    -1504.        20024.
#> # ℹ 44 more rows
plot(dcmp, title = "Visitors to Australia")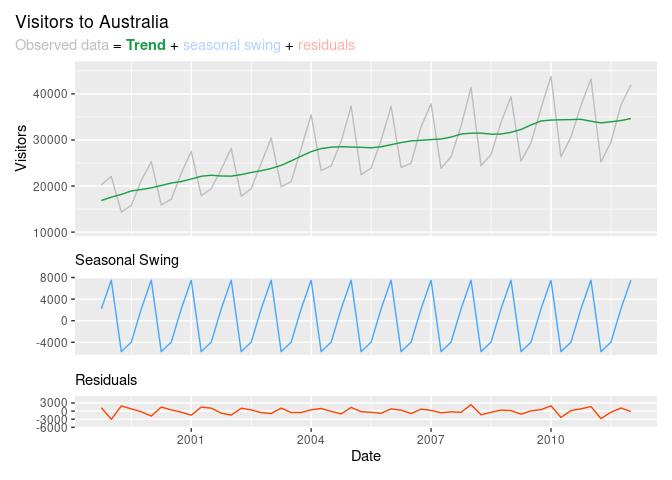
Visualising seasonal effects
Plots are helpful in revealing the underlying seasonal pattern of time series data.
seasonplot(data)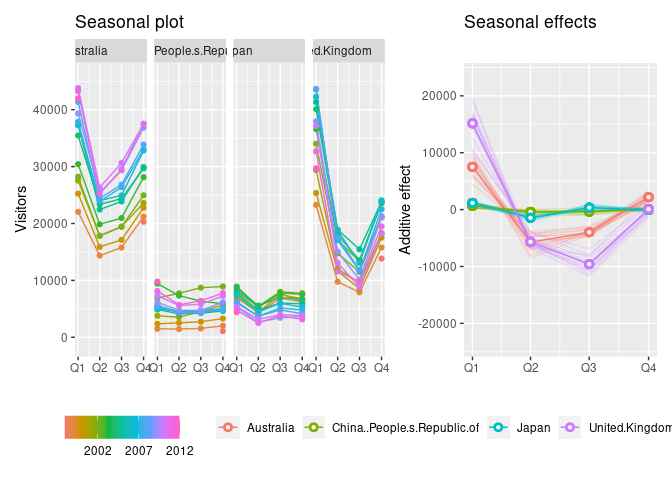
subseries(data)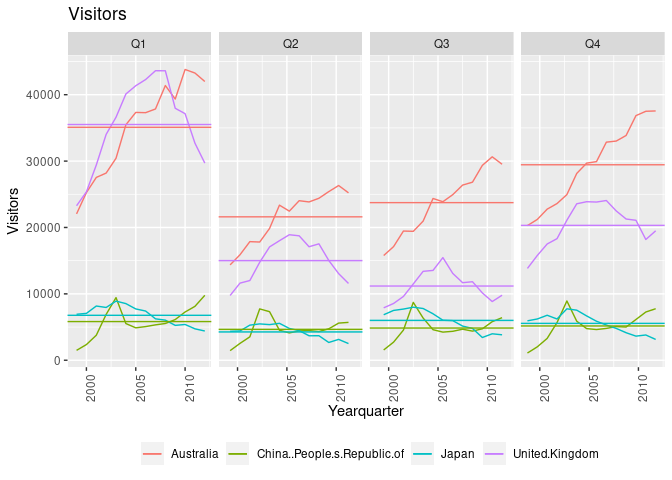
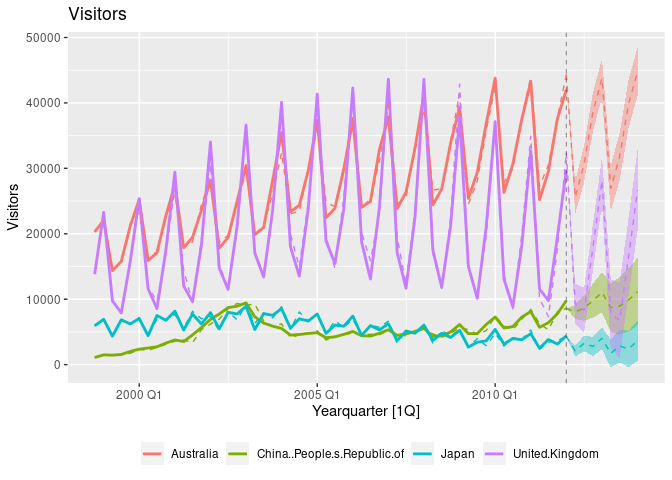
Forecasting
pred <- predict(data)
summary(pred)
#>
#> 95% Prediction Interval
#> # A tsibble: 32 x 5 [1Q]
#> # Key:       Country [4]
#>    Country                        Time Fitted  Lower  Upper
#>    <chr>                         <qtr>  <dbl>  <dbl>  <dbl>
#>  1 Australia                   2012 Q2 25550. 23052. 28047.
#>  2 Australia                   2012 Q3 30625. 27790. 33461.
#>  3 Australia                   2012 Q4 38674. 35748. 41600.
#>  4 Australia                   2013 Q1 43773. 40821. 46724.
#>  5 Australia                   2013 Q2 26915. 23421. 30409.
#>  6 Australia                   2013 Q3 31797. 28162. 35433.
#>  7 Australia                   2013 Q4 39874. 36199. 43549.
#>  8 Australia                   2014 Q1 44769. 41082. 48456.
#>  9 China..People.s.Republic.of 2012 Q2  8069.  6999.  9138.
#> 10 China..People.s.Republic.of 2012 Q3  8624.  6704. 10544.
#> 11 China..People.s.Republic.of 2012 Q4  9797.  7199. 12395.
#> 12 China..People.s.Republic.of 2013 Q1 11054.  7964. 14145.
#> 13 China..People.s.Republic.of 2013 Q2  8710.  4944. 12477.
#> 14 China..People.s.Republic.of 2013 Q3  8957.  4581. 13333.
#> 15 China..People.s.Republic.of 2013 Q4  9874.  5038. 14710.
#> 16 China..People.s.Republic.of 2014 Q1 11139.  5991. 16287.
#> 17 Japan                       2012 Q2  2106.  1267.  2945.
#> 18 Japan                       2012 Q3  3239.  2052.  4425.
#> 19 Japan                       2012 Q4  2789.  1336.  4242.
#> 20 Japan                       2013 Q1  4017.  2340.  5695.
#> 21 Japan                       2013 Q2  1719.  -397.  3835.
#> 22 Japan                       2013 Q3  2851.   374.  5329.
#> 23 Japan                       2013 Q4  2401.  -391.  5194.
#> 24 Japan                       2014 Q1  3630.   554.  6706.
#> 25 United.Kingdom              2012 Q2  9296.  6244. 12349.
#> 26 United.Kingdom              2012 Q3  8283.  4829. 11737.
#> 27 United.Kingdom              2012 Q4 17986. 14450. 21522.
#> 28 United.Kingdom              2013 Q1 28182. 24566. 31798.
#> 29 United.Kingdom              2013 Q2  7784.  2531. 13037.
#> 30 United.Kingdom              2013 Q3  6771.  1006. 12535.
#> 31 United.Kingdom              2013 Q4 16474. 10514. 22434.
#> 32 United.Kingdom              2014 Q1 26670. 20520. 32820.
#>
#> Model:
#> # A mable: 4 x 2
#> # Key:     Country [4]
#>   Country                                              Visitors
#>   <chr>                                                 <model>
#> 1 Australia                   <ARIMA(1,0,0)(1,1,0)[4] w/ drift>
#> 2 China..People.s.Republic.of          <ARIMA(2,0,0)(1,1,0)[4]>
#> 3 Japan                                <ARIMA(0,1,0)(0,1,1)[4]>
#> 4 United.Kingdom                       <ARIMA(0,1,2)(0,1,0)[4]>
plot(pred)